


Research into the business case for inclusive design
Businesses that are not accommodating customers with disabilities are missing out on their spending power by failing to develop inclusive digital websites, apps and products accessible to them.
Scope partnered with Open Inclusion and Barclays Access. We studied the spending and purchasing power of disabled people online. These findings support much of the feedback we have had from disabled people.
How a lack of inclusive design affects spending decisions
Half of people surveyed who had problems buying items ended up not buying the product. Another 48% found a different provider and purchased their products elsewhere.
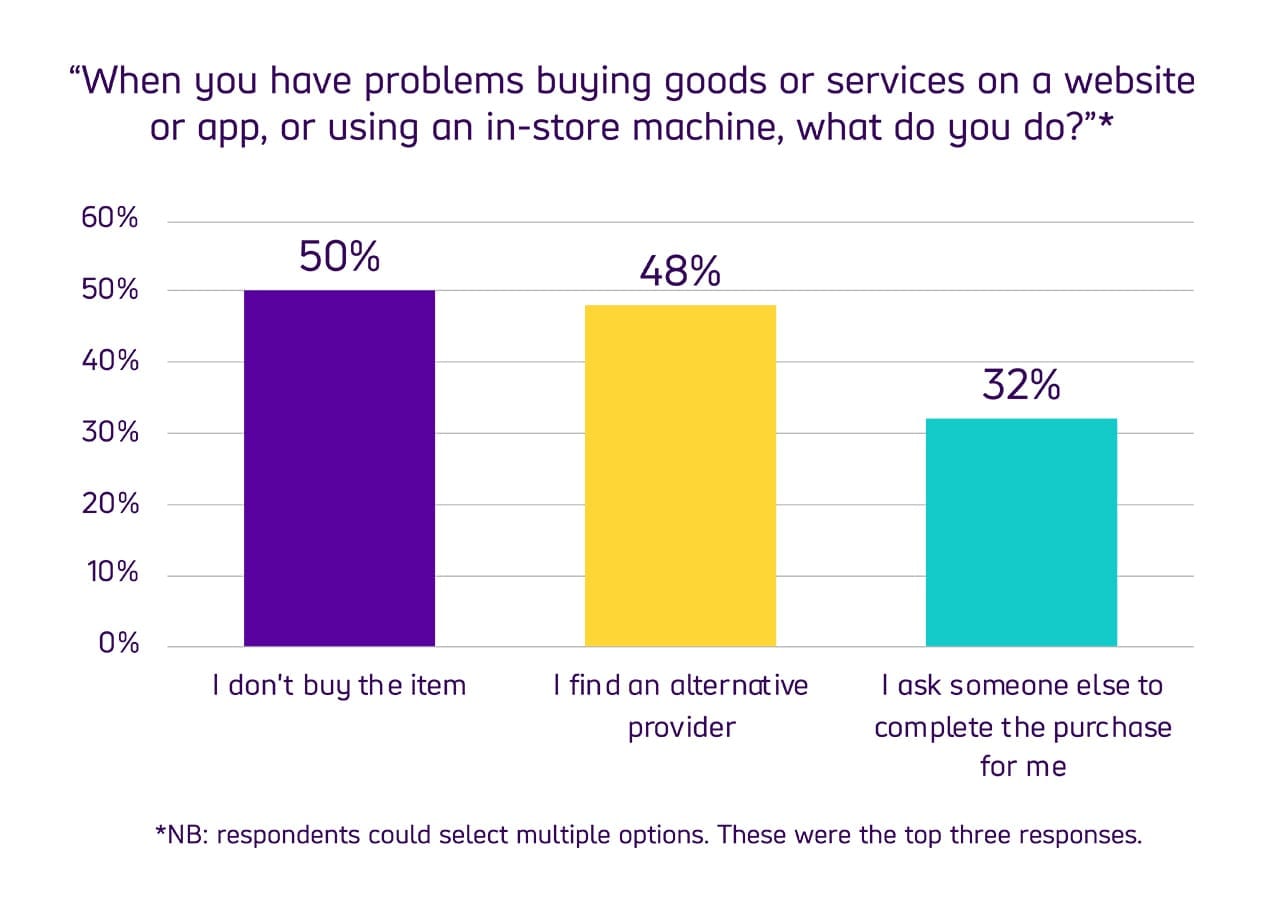
When businesses fail disabled customers online, most will choose to not to continue. Or find another company with a more accessible website. While respondents could select multiple options, these were the top responses:
- 50% chose not to buy the item
- 48% found an alternative provider to buy the item more easily
- 32% asked someone in their household to complete the purchase for them
I’m unable to book tickets to theatres or gigs. Unable to find accessibility information for business and services online. Unable to flag to companies that I have access needs. For example, utility companies, doctors clinics.
Survey respondent
Where people experience the most digital accessibility issues
We know that accessibility issues are prominent in all industries. We asked disabled users which category most poor digital experiences fell into.

At the top of the list was groceries. 39% of respondents said they had problems purchasing or ordering food or drink online.
Train-booking websites were the second most common area. 38% of users reporting difficulty using train travel services online. 36% of respondents reported poor digital experiences with clothing and footwear retailers.
| Category for most common poor digital experiences | Percentage of respondents who experienced issue |
|---|---|
| Groceries (food or drink to eat at home) | 39% |
| Trains (above ground) | 38% |
| Clothing and footwear | 36% |
| Food or drink to eat out or takeaway | 30% |
| Hotels, Motels, Bed and Breakfasts | 26% |
| Entertainment, sports and leisure | 25% |
| Phone and internet bills | 25% |
| Homeware, furnishings, small appliances, garden products | 22% |
| Utilities (electricity, water, gas, other fuels) | 21% |
| Medical or dental services | 19% |
I would like to spend more than I currently do, but I can’t because it’s such a laborious task. If websites, apps and stores were more accessible, then I’d spend more. The Purple Pound is worth a lot. But businesses don’t seem to realise this and put the effort in to make their products and websites accessible in order to benefit from it.
Survey respondent
Most common accessibility barriers faced online
47% of respondents said website navigation was the main issue for them. Other issues included checkout requirements. 45% of respondents experienced a barrier to purchasing.
| Accessibility issue | Percentage of respondents who experienced issue |
|---|---|
| Navigating around the website | 47% |
| Cannot complete CAPTCHA puzzle or other checkout requirements | 45% |
| Difficulty registering online | 34% |
| Having to use the phone service and speaking with a salesperson | 30% |
| Difficulty finding things they want and putting them in the basket | 28% |
| Worrying they will get scammed | 28% |
| Worrying they will be charged extra money | 27% |
| Finding it difficult to pay for things and check out | 25% |
| Finding it difficult to understand the details of a website (like price or tariffs) | 22% |
| Phone staff are not helpful or respectful | 22% |
The businesses missing out
75% of people think UK businesses are losing out because their services are not inclusive.

Disabled people were asked what they would like to spend more money on if there were no accessibility barriers.
- 67% said entertainment, sports and leisure
- 53% said clothing and footwear
- 44% said hotel bookings
The potential of The Purple Pound
The latest Purple Pound estimate is £274 billion according to the ONS.

The Purple Pound is the total income (after housing cost) of households with at least 1 disabled person.
We believe businesses can, and should, build more inclusive products and services.